If you’ve ever looked at a forex chart and wondered how traders seem to “predict” where the market will turn — the answer might lie in a simple yet powerful tool called Fibonacci Retracement.
At first glance, the word Fibonacci might sound like something out of a math textbook, but don’t worry — you don’t need to be a mathematician to use it. In fact, once you understand how it works, you’ll see why it’s one of the most popular tools in forex trading.
So, grab your coffee, relax, and let’s break down this fascinating concept in a way that’s easy (and even fun!) to understand.
🌀 What is a Fibonacci Retracement?
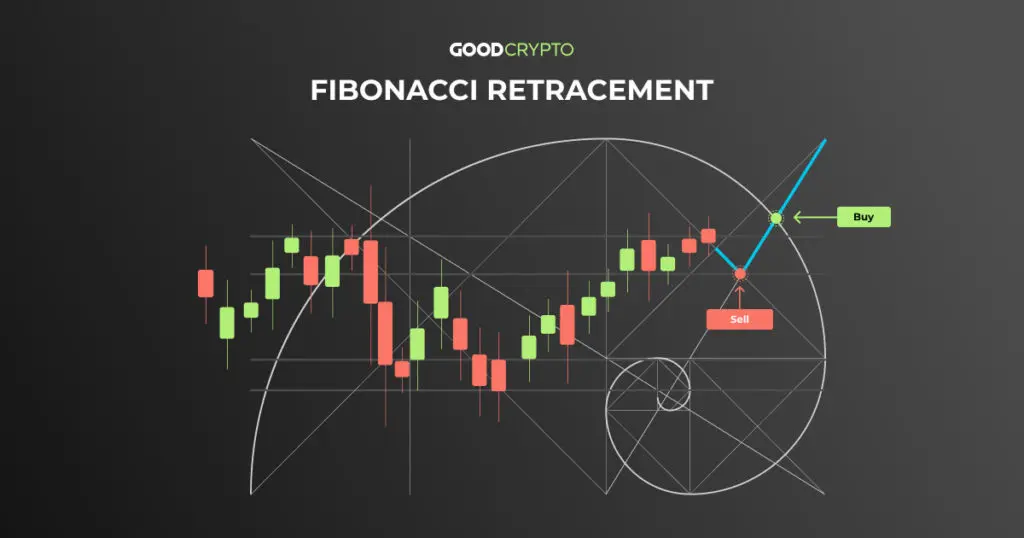
The Fibonacci Retracement is a technical analysis tool used to identify potential reversal levels in a trending market.
In simpler terms, it helps traders spot where the price might “pull back” (or retrace) before continuing in the same direction.
The tool is based on the Fibonacci sequence — a series of numbers (0, 1, 1, 2, 3, 5, 8, 13, 21, …) that appear frequently in nature, art, and even financial markets. When these numbers are converted into ratios, they form levels that traders use to forecast potential turning points in price.
📏 The Key Fibonacci Levels
When you apply the Fibonacci Retracement tool to a chart, it automatically draws horizontal lines at specific percentage levels of the prior price move.
The most commonly used levels are:
- 23.6%
- 38.2%
- 50% (not officially Fibonacci, but widely used)
- 61.8%
- 78.6%
Each level represents how much of the previous move the market could retrace before resuming its trend.
For example:
If EUR/USD rises from 1.0800 to 1.1000, and then starts to fall, traders will watch levels like 1.0952 (23.6%), 1.0924 (38.2%), and 1.0890 (61.8%) for potential buying opportunities — assuming the overall trend is still upward.
🧭 How to Use Fibonacci Retracement in Forex Trading
Let’s go step-by-step so you can start applying Fibonacci levels to your own trades.
Step 1: Identify the Trend
First, determine whether the market is in an uptrend or downtrend.
- In an uptrend, you’ll apply the Fibonacci tool from the swing low to swing high.
- In a downtrend, you’ll do the opposite — from swing high to swing low.
This helps the tool automatically plot the retracement levels between 0% and 100%.
Step 2: Wait for a Pullback
Markets rarely move in a straight line. After a strong move, the price usually retraces — or pulls back — before continuing in the same direction.
This is where Fibonacci comes in handy. Traders look for entries near one of the key retracement levels, expecting the price to bounce and resume the trend.
Step 3: Confirm with Other Indicators
Fibonacci works best when combined with other forms of technical analysis.
Look for confirmation signals like:
- Candlestick patterns (e.g., hammer, engulfing candle)
- Moving averages (support/resistance zones)
- RSI or MACD (momentum indicators)
When multiple signals align near a Fibonacci level, your trade setup becomes much stronger.
Step 4: Plan Your Entry, Stop, and Take Profit
- Entry: When price shows signs of bouncing from a Fibonacci level (like 38.2% or 61.8%).
- Stop Loss: Place just beyond the next Fibonacci level to limit your risk.
- Take Profit: Use previous highs/lows or another Fibonacci extension (like 161.8%) to set a realistic target.
💡 Example: Fibonacci Retracement in Action
Imagine the GBP/USD pair rises from 1.2500 to 1.2700 — a 200-pip move.
Then, it starts to drop back. You apply the Fibonacci tool, and it marks retracement levels at:
- 23.6% → 1.2652
- 38.2% → 1.2624
- 61.8% → 1.2576
If the market finds support around 1.2620 (38.2%) and starts rising again, that’s your potential buy signal.
A stop loss could go just below 1.2570, and your target might be near the previous high (1.2700) or even higher.
⚖️ Why Fibonacci Retracements Work
While no tool can predict the market perfectly, Fibonacci retracements work because many traders around the world use them — including big institutional players.
This creates a self-fulfilling prophecy: when enough traders expect price reactions at certain levels, the market often behaves accordingly.
Moreover, the Fibonacci ratios reflect natural balance and rhythm, which tend to appear in all kinds of data — from seashell spirals to stock charts.
🚫 Common Mistakes to Avoid
Even though Fibonacci retracements are simple to use, beginners often make a few common mistakes:
- Forcing Fibonacci on random price moves – Always use clear, well-defined swing highs and lows.
- Relying on Fibonacci alone – Combine it with other indicators or chart patterns.
- Ignoring market context – Fibonacci works best in trending markets, not choppy sideways conditions.
By avoiding these pitfalls, you’ll make the most out of this powerful tool.
🧠 Pro Tip: Combine Fibonacci with Price Action
Want to level up your trading? Combine Fibonacci retracement levels with price action signals like pin bars, engulfing candles, or support/resistance zones.
For example:
If you spot a bullish engulfing candle right at the 61.8% retracement, it’s a strong sign that buyers are stepping in — and that could be your cue to enter.
🎯 Final Thoughts: Simplicity Meets Precision
The Fibonacci Retracement is more than just a fancy math concept — it’s a roadmap that helps you understand where the market might pause, reverse, or accelerate.
Used wisely, it can help you:
- Enter trades with confidence
- Set more accurate targets
- Manage risk more effectively
As with all trading tools, practice is key. Try applying Fibonacci retracements on a demo account first, experiment with different timeframes, and see how price reacts around those golden ratios.
Remember:
“Fibonacci doesn’t predict the future — it helps you prepare for it.”
✅ Key Takeaways
- Fibonacci retracements identify potential pullback zones within a trend.
- Key levels: 23.6%, 38.2%, 50%, 61.8%, and 78.6%.
- Always use clear swing highs and lows.
- Combine with other indicators or candlestick patterns for confirmation.
- Great for spotting entries, setting stops, and planning exits.