If you’ve ever watched the forex market move up and down and wondered how traders know when to buy or sell, here’s the secret: they don’t just guess — they use indicators.
Indicators are like your GPS for forex trading. They help you understand the market’s direction, momentum, and possible turning points. And when you’re day trading — making quick decisions and aiming to profit from short-term price moves — the right indicators can make all the difference.
In this guide, we’ll explore the 7 best indicators for day trading forex, how to use them, and why traders love them. Let’s dive in! 🌊
🧭 1. Moving Averages (MA) — The Trend Tracker
The Moving Average is one of the simplest and most powerful indicators for day trading. It smooths out price data to show the overall direction (trend) of the market.
There are two main types:
- Simple Moving Average (SMA) — averages prices over a set period.
- Exponential Moving Average (EMA) — gives more weight to recent prices, reacting faster to market changes.
How to use it:
- When the price is above the moving average, it signals an uptrend — consider looking for buy opportunities.
- When the price is below, it suggests a downtrend — focus on sells.
- Combine two EMAs (like 9-day and 21-day). When the shorter EMA crosses above the longer one → bullish signal. When it crosses below → bearish signal.
Why traders love it:
It’s clean, simple, and helps you avoid trading against the trend — one of the most common beginner mistakes.
⚙️ 2. Relative Strength Index (RSI) — The Momentum Gauge
The RSI measures how strong or weak the market momentum is. It oscillates between 0 and 100, helping traders spot overbought or oversold conditions.
How to use it:
- RSI above 70 → market is overbought (a potential sell signal).
- RSI below 30 → market is oversold (a potential buy signal).
- RSI divergence (price moving one way while RSI moves the other) often warns of trend reversals.
Example:
If EUR/USD is rising but RSI is falling, it might signal that momentum is fading — a reversal could be coming.
Why traders love it:
It’s great for timing entries and exits, especially in choppy or range-bound markets.
📊 3. Moving Average Convergence Divergence (MACD) — The Trend + Momentum Combo
The MACD is a favorite among professional day traders because it combines trend-following and momentum in one indicator.
It consists of:
- MACD Line
- Signal Line
- Histogram
How to use it:
- When the MACD line crosses above the signal line → bullish signal (potential buy).
- When it crosses below → bearish signal (potential sell).
- The histogram helps visualize the strength of the trend — longer bars mean stronger momentum.
Why traders love it:
MACD provides early signals of trend changes and helps confirm the strength of ongoing moves — perfect for fast-paced day trading.
💡 4. Bollinger Bands — The Volatility Detector
Created by John Bollinger, this indicator shows how volatile the market is and where prices might stretch too far.
It includes:
- A middle line (Simple Moving Average)
- An upper band (SMA + 2 standard deviations)
- A lower band (SMA – 2 standard deviations)
How to use it:
- When the price touches or moves outside the upper band, the market may be overbought.
- When it touches the lower band, it may be oversold.
- A Bollinger squeeze (bands narrowing) signals low volatility — often followed by a breakout.
Why traders love it:
It helps spot high-probability breakout setups and gauge when the market might be about to make a big move.
⏱️ 5. Stochastic Oscillator — Timing the Turnaround
The Stochastic Oscillator compares a currency pair’s closing price to its price range over a set period, showing how close prices are to their highs or lows.
How to use it:
- It moves between 0 and 100.
- Above 80 → overbought (potential sell).
- Below 20 → oversold (potential buy).
- Watch for crossovers between the %K and %D lines for entry signals.
Example:
If AUD/USD is oversold below 20 and %K crosses above %D, it’s a signal that buyers might be stepping in.
Why traders love it:
It’s a great tool for identifying potential turning points in short-term price swings — ideal for quick day trades.
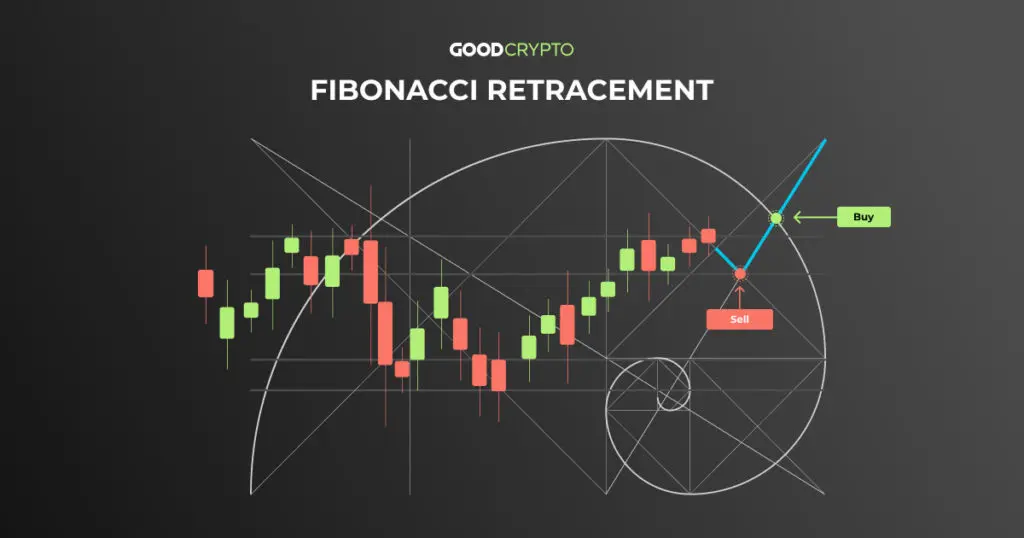
🔥 6. Fibonacci Retracement — The Hidden Support & Resistance Tool
The Fibonacci Retracement isn’t technically an indicator, but it’s one of the most widely used tools in day trading. It helps you find possible support and resistance levels where price might reverse.
How to use it:
- Draw it from a swing low to swing high (in an uptrend) or high to low (in a downtrend).
- Key levels: 23.6%, 38.2%, 50%, 61.8%, 78.6%.
- Watch how price reacts around these levels — they often act as “magnet zones” for price corrections.
Why traders love it:
Fibonacci levels appear naturally in markets and are excellent for timing pullback entries during intraday trends.
📉 7. Volume Indicator — The Market’s Voice
Volume tells you how strong a price move really is. High volume during a breakout means conviction. Low volume? The move might not last.
How to use it:
- Rising prices with increasing volume → strong uptrend confirmation.
- Rising prices with falling volume → trend might weaken soon.
- Combine volume with breakouts for more reliable signals.
Why traders love it:
Volume reveals the truth behind price action — it’s like hearing what the market is really saying.
💬 Bonus Tip: Combine Indicators Wisely
While each of these indicators can work alone, combining two or three can give you a clearer picture.
For example:
- EMA + RSI: Trend direction + entry timing.
- Bollinger Bands + MACD: Volatility breakout + momentum confirmation.
- Fibonacci + Stochastic: Support level + reversal timing.
But be careful — too many indicators can create “analysis paralysis.” Keep your chart clean and focused.
🚀 Final Thoughts: Find What Fits Your Style
There’s no one-size-fits-all indicator in forex. What works for one trader might not work for another. The secret is to understand what each indicator tells you and practice using them together.
Start simple. Pick two or three indicators from this list. Test them on a demo account. Observe how they behave in different market conditions. With time, you’ll develop your own rhythm and confidence.
Remember:
“Indicators don’t predict the market — they help you understand it.”
Trade smart, stay disciplined, and let your indicators guide you — not control you.
✅ Quick Recap: Best Forex Indicators for Day Trading
| Indicator | Purpose | Best For |
|---|---|---|
| Moving Average (MA) | Identify trends | Beginners & trend traders |
| RSI | Spot overbought/oversold | Momentum trading |
| MACD | Confirm trend reversals | Active day traders |
| Bollinger Bands | Gauge volatility & breakouts | Scalpers & breakout traders |
| Stochastic Oscillator | Spot turning points | Short-term traders |
| Fibonacci Retracement | Identify pullback zones | Trend-followers |
| Volume | Confirm trend strength | All traders |