If you’ve ever looked at a trading chart and felt like you’re staring at a secret code — you’re not alone. Those zig-zagging lines, colored candles, and weird shapes might seem confusing at first. But here’s the truth: Charts tell a story, and once you understand their language, you’ll unlock powerful insights.
Welcome to the world of chart patterns, trendlines, and indicators — the tools traders use to predict price movements and make smart decisions. Let’s break it all down in a way that’s not just easy to understand, but also enjoyable to read.
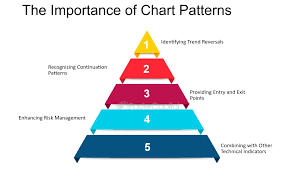
📊 1. Chart Patterns – Market Psychology in Action
Chart patterns are like footprints left behind by traders. They show us where the market might be headed based on how price behaved in the past.
🔺 Common Types of Chart Patterns:
1. Head and Shoulders (Reversal Pattern)
- Looks like: A middle peak (the head) with two smaller peaks (the shoulders).
- What it means: The market is likely to reverse its trend — if it was going up, it may start coming down.
2. Double Top & Double Bottom
- Double Top: Two peaks at the same level = possible downtrend.
- Double Bottom: Two valleys at the same level = possible uptrend.
3. Triangles (Continuation or Reversal)
- Ascending Triangle = Bullish signal
- Descending Triangle = Bearish signal
- Symmetrical Triangle = Watch for a breakout in either direction
4. Flags and Pennants
- Short-term continuation patterns after a strong move.
- Imagine the market “catching its breath” before running again.
🧠 Quick Tip: Chart patterns are not magic. They show probabilities, not certainties. Always combine them with other tools!
📉 2. Trendlines – The Market’s Directional Arrows
Trendlines are the most basic (yet powerful) tools for reading charts. They connect the lows in an uptrend or the highs in a downtrend.
🔼 Uptrend Line:
- Connects rising higher lows.
- Suggests buying pressure and a strong market.
🔽 Downtrend Line:
- Connects falling lower highs.
- Suggests selling pressure and possible weakness.
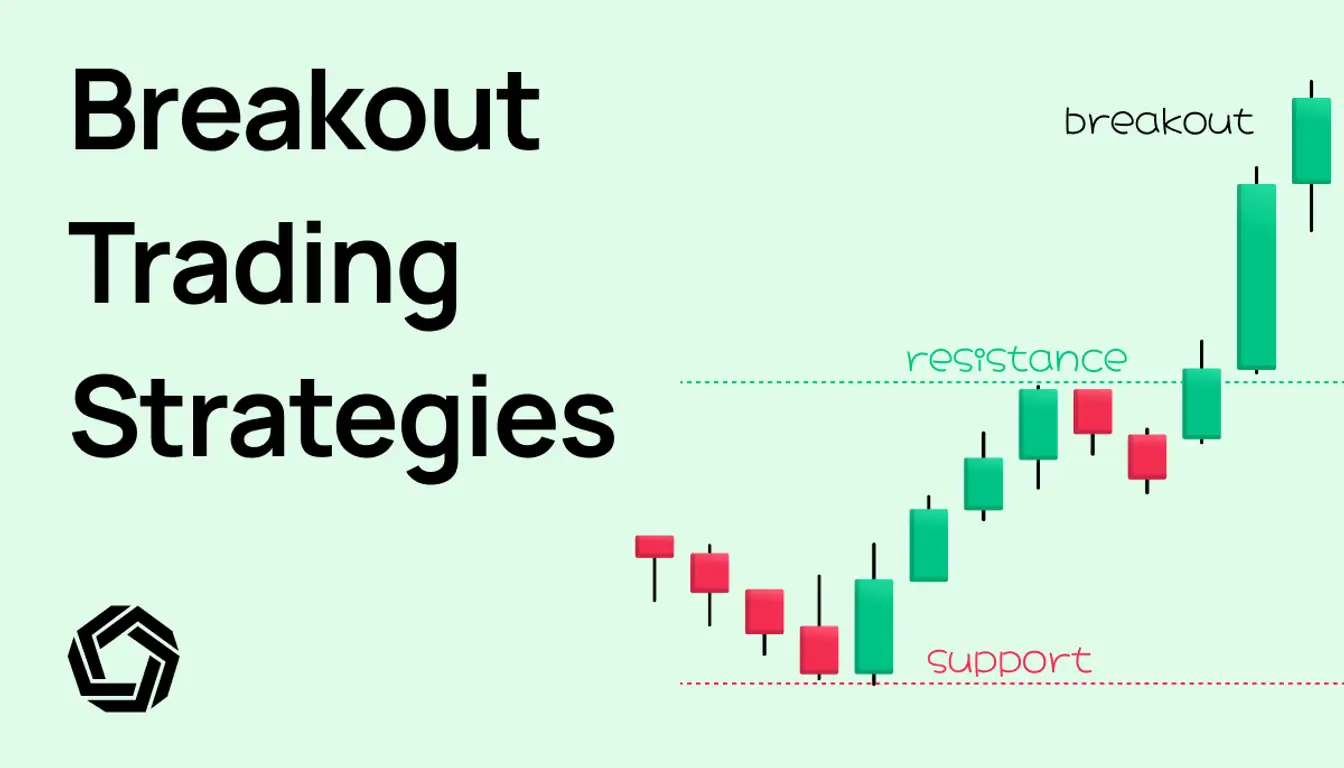
➡️ Sideways Trend (Consolidation):
- Price moves within a range (like bouncing between a floor and ceiling).
- Often seen before a big breakout.
🛠 How to Draw Trendlines:
- Use a line tool on your charting software.
- Connect at least two or more swing highs/lows.
- Don’t force the line — let the market guide you.
📏 Bonus Tip: The more times price touches a trendline without breaking it, the stronger the trendline becomes.
📟 3. Indicators – The Market’s Mood Rings
Indicators are tools added to charts that help confirm trends, signal momentum, or warn of overbought/oversold conditions.
Let’s look at some popular ones:
📈 Moving Averages (MA)
- Simple Moving Average (SMA): Smooths price data over a set period.
- Exponential Moving Average (EMA): Gives more weight to recent prices.
👉 Traders use them to:
- Identify trends
- Spot crossovers (e.g., 50 EMA crossing above 200 EMA = bullish)
📊 Relative Strength Index (RSI)
- Measures momentum on a scale of 0 to 100.
- Above 70 = Overbought (possible drop)
- Below 30 = Oversold (possible rise)
🎯 MACD (Moving Average Convergence Divergence)
- Tracks changes in momentum.
- Consists of two lines + a histogram.
- Crossovers can signal buy/sell opportunities.
💹 Bollinger Bands
- Show volatility.
- When price touches the upper band = possibly overbought.
- When it touches the lower band = possibly oversold.
🧠 Pro Tip: Indicators are best used as confirmation tools, not decision-makers. Don’t rely on one indicator alone.
🧩 How They Work Together
Here’s where the magic happens: combining patterns, trendlines, and indicators gives you a fuller picture.
🔍 Example Strategy:
- Spot an ascending triangle (chart pattern)
- Confirm an uptrend line (trendline)
- Check RSI to make sure it’s not overbought (indicator)
Now you’re not just guessing — you’re trading with logic and confidence.
🧠 Final Thoughts – Practice Makes Profit
Learning to read charts is like learning a new language. At first, it’s unfamiliar. But the more you practice, the more fluent you become.
- Don’t rush.
- Backtest your strategies.
- Stay disciplined.
- Use stop-losses.
- Never risk more than you can afford to lose.
And most importantly: Enjoy the process. The markets are a mix of art, science, psychology, and strategy.
✅ TL;DR – Quick Summary
| Concept | What It Does | Use It For |
|---|---|---|
| Chart Patterns | Visual shapes in price movement | Spotting possible trend changes |
| Trendlines | Straight lines showing direction | Confirming trend strength |
| Indicators | Math-based tools | Supporting your trade decisions |
🎉 Now You Know the Language of Charts!
You’re officially ahead of most beginners who stare at charts without a clue. Whether you want to day trade, swing trade, or invest long-term, these tools are your foundation.
So next time you open a chart, don’t just see lines and candles — see a story, and decide how you want to play it.
Happy trading! 💹💼