Daily Forex Analysis: Dollar Index Breaks Below 200-Day Average as Markets Brace for the Fed
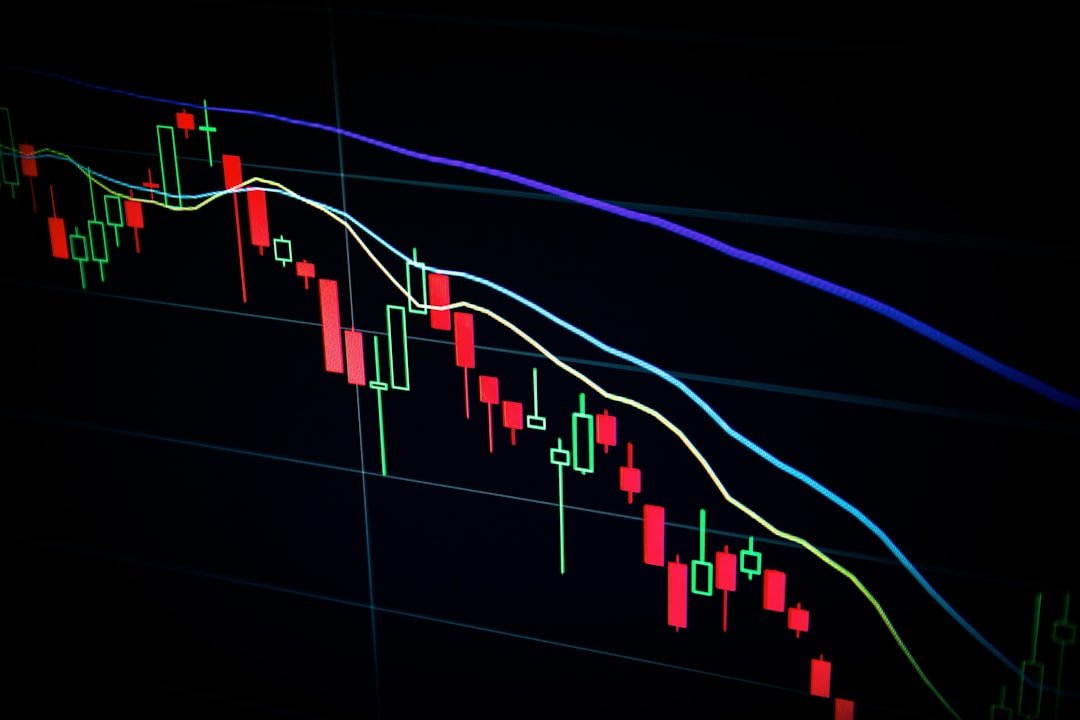
Tuesday, September 8 delivered a quietly significant technical development: the US Dollar Index pushed below its 200-day moving average, printing a fresh lower low in the process. It hasn’t broken the previous major swing low yet, so the structural picture isn’t fully broken down — but the directional bias has clearly tilted lower heading into one of the most consequential weeks of the quarter.
Dollar Index: Weakness Without Confirmation
The DXY’s slide below its 200-day SMA is the kind of move technical traders take seriously, but it comes with an important caveat: momentum hasn’t been confirmed by a break of the prior swing low. That leaves two live scenarios. A confirmed breakdown would open the door to sustained dollar weakness, while a failure to follow through could set up a sideways grind — or even a false breakdown — as the market waits for Friday’s CPI print and next week’s FOMC decision to provide real direction.
EUR/USD: Boxed In, Waiting for a Catalyst
The euro’s price action mirrors the dollar’s indecision. EUR/USD remains trapped between horizontal support at 1.1580 and dynamic resistance at its 200-day simple moving average, with neither buyers nor sellers generating enough conviction to force a breakout. This kind of range-bound consolidation ahead of major data isn’t unusual — it’s the market pricing in uncertainty rather than making a directional bet before the information arrives. A daily close above the 200-SMA would tilt the bias bullish; a break below 1.1580 would do the opposite.
GBP/USD: Modest Gains, No Real Change
Sterling posted modest gains on the day, but the broader picture is essentially unchanged from recent sessions — GBP/USD continues to hover in the middle of its established range, still waiting for the same catalysts moving the euro and dollar.
AUD/USD: The Quiet Outperformer
While the majors chopped sideways, the Australian dollar kept doing what it’s done for weeks: grinding steadily higher. AUD/USD continues its gradual bullish trajectory, with the 0.7300–0.7330 resistance zone standing as the primary target as long as horizontal support holds on pullbacks. It’s a slower, less headline-grabbing move than what’s happening in JPY or the Middle East-driven commodity story, but the consistency of the trend is notable in a week otherwise defined by choppy, catalyst-dependent price action.
Gold: Riding the Dollar’s Weakness
Gold has reversed its earlier downtrend and is trading near $4,360, back above both its 65-day and 200-day exponential moving averages. The fundamentals back up the technical picture — ETF flows turned positive in July with roughly $3 billion in net inflows, and central banks bought 288.9 tonnes of gold in the second quarter alone, up 62% year-on-year. A weaker dollar and elevated geopolitical risk are proving to be a powerful combination for the metal.
What to Watch Tomorrow and Beyond
- Thursday: ECB rate decision, US producer prices, weekly jobless claims
- Friday: US CPI — the last major inflation data before the Fed meets
- September 16: FOMC rate decision
The Takeaway
Today’s session was really about positioning rather than conviction. With the dollar testing key technical support and every major pair sitting at or near a decision point, the market looks like it’s holding its breath. That’s usually a sign that the next few sessions will matter a lot more than the last few did.
This article is for informational purposes only and does not constitute financial or investment advice. Forex trading involves substantial risk of loss.