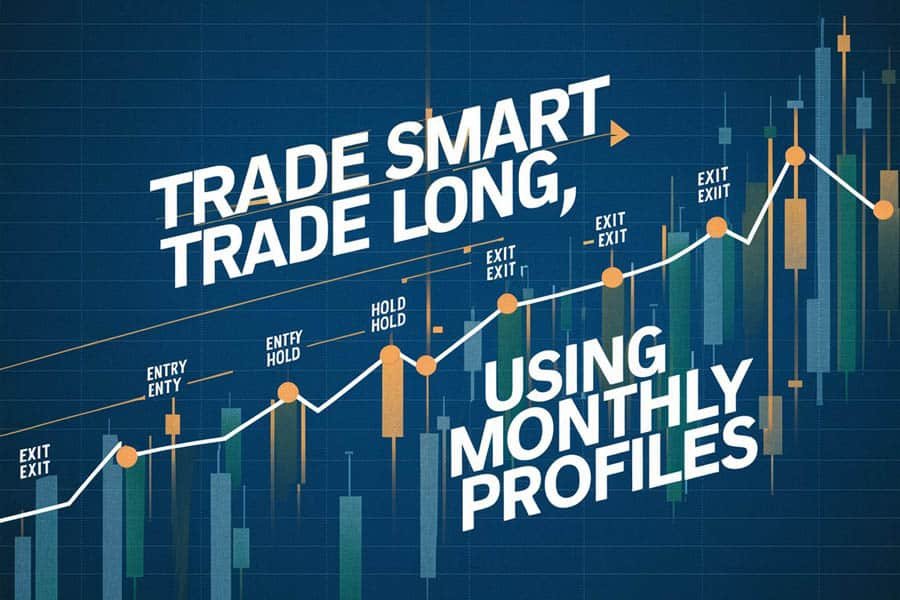
If you’re diving into trading, whether in forex, stocks, or crypto, you’ve probably heard traders talking about RSI, MACD, and Bollinger Bands. These are powerful technical indicators that can help you spot trends, entry points, and exit points, giving you a trading edge.
In this guide, we’ll break down these tools in an easy-to-understand way, with examples and tips to make your trading journey enjoyable and effective.
1. RSI (Relative Strength Index)
What is RSI?
RSI is a momentum indicator that measures the speed and change of price movements. It tells you whether an asset is overbought or oversold, helping traders anticipate potential reversals.
- Scale: 0 to 100
- Key Levels:
- Above 70: Overbought (price may drop soon)
- Below 30: Oversold (price may rise soon)
How to Use RSI
- Look for overbought/oversold levels to find potential reversals.
- Combine RSI with trend analysis for better accuracy.
- Watch for divergence: when price makes a new high/low but RSI doesn’t, it signals a possible trend reversal.
Example:
If EUR/USD has RSI above 70, it may be overbought. A swing trader might prepare to sell or wait for confirmation of a downward move.
2. MACD (Moving Average Convergence Divergence)
What is MACD?
MACD is a trend-following momentum indicator that shows the relationship between two moving averages of a security’s price.
- Components:
- MACD Line – difference between the 12-day and 26-day exponential moving averages (EMA)
- Signal Line – 9-day EMA of the MACD line
- Histogram – difference between MACD line and Signal line
How to Use MACD
- Crossover Signals:
- MACD crosses above the Signal line → Buy signal
- MACD crosses below the Signal line → Sell signal
- Divergence: When price rises but MACD falls, it may indicate a weakening trend.
- Histogram Analysis: Expanding histogram bars indicate strengthening trend, shrinking bars show weakening trend.
Example:
If BTC/USD MACD crosses above the signal line, a trader might consider entering a long position, confirming the trend direction with other indicators.
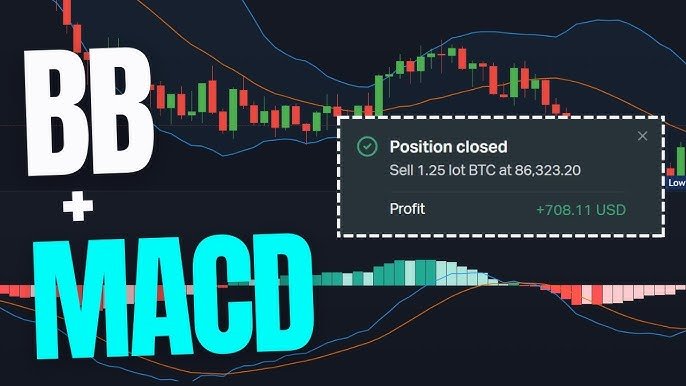
3. Bollinger Bands
What are Bollinger Bands?
Bollinger Bands are volatility indicators that consist of three lines:
- Middle Band: Simple moving average (SMA)
- Upper Band: SMA + 2 standard deviations
- Lower Band: SMA – 2 standard deviations
They show when a market is overbought, oversold, or highly volatile.
How to Use Bollinger Bands
- Price Touching Bands:
- Hitting the upper band → Overbought, possible reversal
- Hitting the lower band → Oversold, possible reversal
- Band Squeeze: Low volatility → Potential breakout
- Band Expansion: High volatility → Trend continuation
Example:
If GBP/USD price touches the lower Bollinger Band and RSI shows oversold conditions, it may signal a buying opportunity.
4. Combining Indicators for Better Accuracy
Using a single indicator may lead to false signals. The key is combining indicators:
- RSI + MACD: RSI confirms overbought/oversold zones, MACD confirms trend direction.
- Bollinger Bands + RSI: Bollinger Bands show volatility and potential reversal zones, RSI confirms entry points.
- MACD + Bollinger Bands: MACD confirms trend, Bollinger Bands indicate breakout or retracement opportunities.
5. Tips for Using Technical Indicators
- Don’t Overload: 2-3 indicators are enough. Too many can confuse you.
- Understand the Market Context: Indicators work best when aligned with trend and news.
- Backtest Your Strategy: Test your indicator setup on historical data before trading live.
- Manage Risk: Use stop-loss orders and proper position sizing.
6. Final Thoughts
RSI, MACD, and Bollinger Bands are trader favorites for a reason. They are versatile, effective, and relatively easy to understand once you practice.
The key is learning how to combine them wisely and always considering market conditions. Over time, you’ll start reading charts like a pro and spotting trading opportunities faster and more confidently.
Remember: Technical indicators guide your decisions—they don’t guarantee profits. Combine them with risk management, patience, and discipline, and you’re on your way to trading success.